
How to Build a Sales Reporting Cadence for Visibility
Reporting isn’t a rcord you file at the end of the month. It’s the cadence that keeps a sales team in action.
Most sales reports get read once. The team opens the Monday roll-up, nods at the numbers, and gets back to selling. By Friday, nobody remembers what it said, and the rep who was quietly slipping behind has lost another week. The report was accurate. It just arrived as history, written for the people who could least act on it.
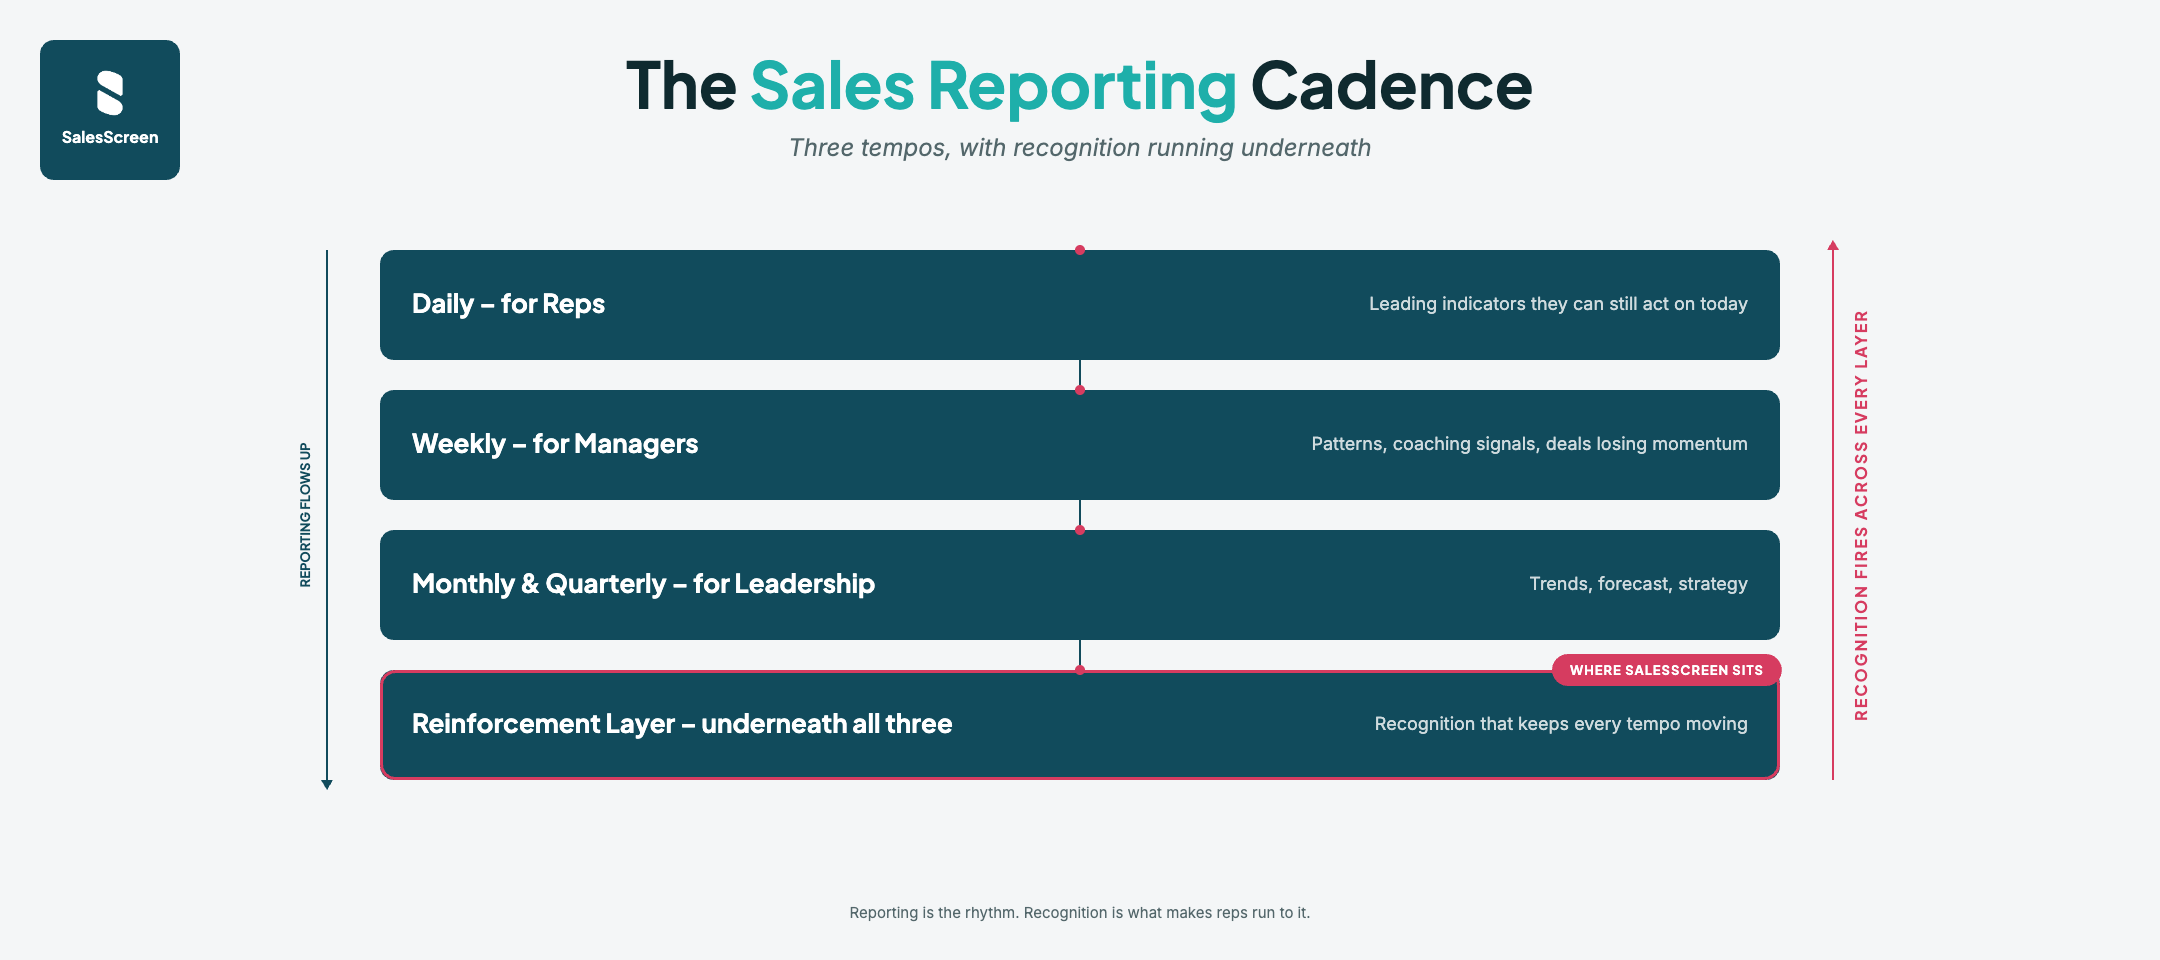
That’s the quiet problem with sales reporting, and it’s rarely about data. It’s about rhythm. Most reporting runs on a cadence built for leadership review, while the behavior it should influence occurs daily, on phones and in inboxes. The fix isn’t more reports. It’s a system where the right information reaches the right person at the speed they can act on it: daily for the rep, weekly for the manager, monthly for the leader, with recognition running underneath so the numbers actually land. Get that right, and reporting stops being a backward glance and starts steering the quarter while it’s still open.
Key takeaways
- A sales reporting cadence has three tempos: daily for reps, weekly for managers, and monthly or quarterly for leadership. Match the frequency to the speed at which each audience can actually act on it.
- Reporting faster than anyone can act is just anxiety. Reporting slower than the behavior is just history.
- Leading indicators (activity, meetings, pipeline created) belong in the daily and weekly layers. Lagging indicators (win rate, quota attainment) belong at the leadership tempo for trend and forecast.
- Most reporting setups skip the reinforcement layer, which runs underneath all three tempos. Visibility shows a rep where they stand. Recognition tells them it was noticed. Together, they’re what make reporting drive behavior instead of just recording it.
- More dashboards aren’t more visibility. One clear view per audience, refreshed at the right tempo, always beats five dashboards nobody opens.
The report is fine. The timing is the problem.
Walk into most sales teams and you won’t find a shortage of reporting. You’ll find CRM dashboards, activity logs, weekly roll-ups, pipeline summaries, and the monthly deck. The information exists. What’s missing is movement. The numbers describe what already happened, they reach the people who can act on them late, and acting on them was never quite the point. Most reports were built to be reviewed, not used.
There’s a real cost to that. Salesforce found that reps spend roughly 60 percent of their time on work that isn’t selling, a good chunk of it data entry and internal reporting. Every manual report you add to a rep’s week is time taken from the phones. Reporting that piles on admin while burying the useful signal is the worst of both worlds, and it’s a surprisingly common setup.
So the fix isn’t another report. It’s cadence. A sales team is a system in motion, and like any system it responds to feedback at the speed that feedback arrives. Give a rep their numbers on Friday, and you’ve handed them a grade. Give them the same numbers on Tuesday at 2 pm, and you’ve handed them a chance. Same data at a different tempo, completely different behavior.
A reporting cadence has more than one tempo
The mistake hiding inside most reporting setups is treating reporting as one thing delivered on one schedule, usually weekly or monthly, usually to management. In practice, a healthy reporting cadence runs at three tempos at once, because the three audiences inside a sales org need different things at different speeds. A rep, a manager, and a VP aren’t reading for the same reason, and a single report built to serve all three tends to serve none of them well.
Daily: the rep needs to see themselves
The daily layer belongs to the rep, and it has one job: show each person where they stand right now against a goal they care about. This is where leading indicators live. These are the inputs a rep can still change today: calls made, meetings booked, pipeline created, proposals sent. They’re very different from a closed-won number that was decided weeks ago. The value of real-time sales data at this layer isn’t that it holds more information. It’s that it arrives while the day is still open.
Format matters as much as timing here. A figure buried in a report a rep has to go looking for might get checked once a week. The same figure shown as ambient, visual data visualization on a shared screen or a personal view gets absorbed without anyone running a thing. A mid-market SaaS team running a manual SPIFF feels this right away. When the standings update live, the contest does the managing. In a multi-location insurance agency, an advisor watching their production target tick forward across the branch gets a completely different kind of feedback than they’d get from reading it in a Monday email.
Weekly: the manager needs to see patterns
The weekly layer belongs to the manager, and it reads differently from the rep’s view. A manager isn’t watching one person’s standings. They’re looking for patterns across a team: who’s trending down midweek, where pipeline is stalling, which rep is producing high activity with low conversion (a coaching signal, not a discipline one). This is the rhythm of sales performance management, the recurring beat where data turns into a conversation.
Coaching is where the weekly cadence earns its keep. The catch is that managers are stretched, and spotting which of twelve reps needs attention this week is hard to do by reading raw dashboards. This is where Scout AI helps, surfacing the rep whose activity slipped against their baseline before it becomes a missed number. Gartner’s research points the same way, finding that AI is well suited to monitoring signals and surfacing the next best action while sellers stay differentiated in judgment and context. A regional manager in a bank, running a pod of five to twelve advisors across branches, doesn’t have time to inspect every record. They need the week’s signal handed to them, not buried in one.
Monthly and quarterly: leadership reads the trend
The slowest layer belongs to leadership, and it’s the one most reporting setups over-build. Monthly and quarterly reporting is for trend, strategy, and the forecast. It leans on lagging indicators, the outcomes that confirm whether the strategy is working. Sales efficiency, win rate, quota attainment, revenue by segment. These numbers matter enormously for planning. They’re simply the wrong tool for changing this week’s behavior, because by the time they settle, the period that produced them is already closed.
The interesting move at this layer is dragging some of it forward in time. That’s the promise of predictive sales analytics, reading the leading signals early enough that a trend toward a missed quarter shows up in week three instead of week twelve. The horizon can be long without the cadence being slow.
The layer most teams skip: reinforcement
Here’s the part no reporting guide written by a dashboard vendor will tell you. A reporting cadence that only flows upward is invisible to the people whose behavior it’s supposed to change. If your reporting rhythm ends with a number landing on a manager’s desk, you’ve built a review system, not a performance one. The reps generating the data rarely see it framed in a way that means anything to them, and information that isn’t seen can’t motivate anyone.
The cost of that isn’t abstract. Gallup found that low employee engagement drains roughly $10 trillion from the global economy each year, close to 9 percent of GDP, and that engagement has slid for a second straight year. Recognition is one of the cheapest ways to push in the other direction, and it lives in your reporting rhythm whether you design it there or not.
This is the reinforcement layer, and it runs underneath all three tempos. Visibility tells a rep where they stand. Recognition tells them it was noticed. When a milestone hit at 11 am triggers a visible moment for the team, the report stops being a record and becomes a reason to push. This is the gap SalesScreen closes, and it’s deliberately the layer most reporting ignores, because recognition is challenging to schedule and easy to skip. A cadence that celebrates progress, not just the final outcome, is what keeps a hybrid team engaged through the long stretch between closed deals. Reps who set and track their own goals stay accountable without being managed by the hour.
Designing your cadence
You don’t need a bigger reporting stack to build this. You need to decide, for each audience, what they see and how often. A short pass through the design looks like this.
- Start with the decision, not the metric. Ask what action each layer should drive, then report only the numbers that drive it. A daily rep view crowded with thirty metrics produces noise, not focus.
- Split leading from lagging by audience. Put leading indicators like activity, pipeline created, and response time in the daily and weekly layers where they can be acted on. Keep lagging indicators like quota attainment and win rate in the monthly and quarterly view.
- Match frequency to the speed of the action. Reps see daily, managers review weekly, leaders read monthly and quarterly. Reporting faster than anyone can act is just anxiety, and reporting slower than the behavior is just history.
- Build one view per audience, not one view for everyone. A rep’s screen, a manager’s pattern view, and a leadership trend deck are three designs, not one shared dashboard stretched three ways.
- Add the reinforcement beat on purpose. Decide how progress gets recognized and on what rhythm, so it doesn’t get skipped during the first busy week.
One caution as you build. More dashboards isn’t more visibility. HubSpot’s research found that the highest-performing teams invest in technology that improves visibility and decision-making, rather than simply stacking on more tools. The aim of a reporting cadence is the opposite of clutter. One clear view per audience, refreshed at the right tempo, will always beat five dashboards nobody opens.
Make reporting something your team runs on
Sales reporting earns its place when it stops being something you produce and starts being something your team runs on. The data is already there. What changes outcomes is the cadence, the right view reaching the right person at the speed they can still do something about it, with recognition built in so the numbers carry real weight. Pick one layer to fix first. Most teams find the daily rep view is where the fastest change lives, because that’s where behavior actually happens. If you want to see what a live, reinforcing daily cadence looks like in practice, take a look through the SalesScreen demo library and watch the leading indicators come to life.
Frequently asked questions
What is a sales reporting cadence?
A sales reporting cadence is the rhythm at which sales data reaches each audience: daily for reps, weekly for managers, monthly and quarterly for leadership. The point is matching the frequency and content of a report to the speed at which that audience can act on it, so reporting drives behavior instead of just recording it.
How often should you run sales reports?
It depends on who’s reading and what they can change. Reps benefit from real-time or daily visibility into leading indicators they can still influence. Managers work well on a weekly coaching rhythm focused on patterns. Leadership reads monthly and quarterly for trend and forecast. Reporting faster than an audience can act creates noise, and slower than the behavior creates history.
What’s the difference between leading and lagging indicators in reporting?
Leading indicators are inputs that predict outcomes, such as calls made, meetings booked, and pipeline created. Lagging indicators are the results, such as quota attainment and win rate. Leading indicators belong in the fast daily and weekly layers where reps and managers can act on them. Lagging indicators belong in the slower leadership layer for review and planning.
Why do sales reports often fail to change behavior?
Usually because of timing and audience, not data quality. Many reports arrive after the period they describe and are written for leadership review rather than rep action. A report that lands too late or never reaches the person whose behavior it should influence can explain a result but can’t improve one.
What should a daily report show a rep versus a manager?
A rep’s daily view should be personal and current: their own activity and progress against a goal they care about, shown clearly enough to act on in the next few hours. A manager’s view should surface patterns across the team, such as who’s trending down midweek or where the pipeline is stalling, so coaching can be proactive rather than reactive.
How do you make sales reporting motivating instead of administrative?
Add a reinforcement layer. Visibility shows reps where they stand, and recognition shows them it was noticed. When reporting connects progress to visible recognition, and when reps have ownership of the goals being measured, the numbers start to carry emotional weight rather than reading as oversight.