
What Is a Sales Conversion Rate and How Do You Measure It?
Your conversion rate told you the quarter was in trouble in week eleven. You needed to know in week two. That’s the problem with how most teams use the number: it shows up on a report after the deals are already won or lost, right when there’s nothing left to do about it.
It doesn’t help that half your team defines it differently. Ask around and one manager’s counting leads that turn into opportunities, another’s counting deals that actually close, and the number on the board is quietly an average of both. They’re all technically right, which is exactly why the metric so often means nothing.
A sales conversion rate is the percentage of prospects who take a desired action, usually becoming a customer, out of everyone who entered that stage. Simple enough. But it’s only as useful as the definition underneath it, and only worth tracking if you can act on it while a deal is still live. This article covers what it is, how to calculate it at every stage, what counts as good, and how to turn it from a number you report into a signal your team can move on.
Key takeaways
- A sales conversion rate only means something when you name the two points it sits between. “20% conversion rate” is vague. “20% SQL-to-opportunity rate” is something a manager can work with.
- The formula is simple: conversions divided by total prospects who entered the stage, times 100. The decision that actually matters is what goes in the denominator, and it has to stay consistent over time.
- Benchmarks are a loose reference, not a target. Your own trend line, and your own top performer’s rate, matter more than any industry average.
- Read stage by stage, not blended, and the rate becomes a diagnostic instead of a scoreboard. A rep’s meeting-to-opportunity rate slipping over three weeks is an early warning you can coach, not a post-mortem you write later.
- Improving the rate starts with tightening qualification and responding to leads faster, then coaching the specific stage where deals are actually leaking.
What is a sales conversion rate?
A sales conversion rate measures how well your team moves prospects from one defined point to the next. At its broadest, it’s the share of leads that turn into customers. In practice, the version worth tracking is more specific: lead to qualified opportunity, opportunity to close, or whichever stage pair actually maps to how you sell.
The trouble starts when one phrase gets stretched across completely different transitions. A lead-to-opportunity rate, a lead-to-customer rate, and an opportunity-to-close rate are all “conversion rates,” and they answer totally different questions. A 15% lead-to-opportunity rate and a 25% opportunity-to-close rate aren’t the same story told twice. Treat them as interchangeable and you’ll build dashboards that look sharp and tell you nothing.
The fix isn’t a tool. It’s a habit. Whenever you quote a conversion rate, name the two points it sits between. “Our conversion rate is 20%” means nothing. “Our SQL-to-opportunity rate is 20%” is something a manager can actually work with. Precise definitions are what separate a vanity number from a useful one.
The sales conversion rate formula
The formula is the easy part. Take your conversions, divide by the total prospects who entered the stage, multiply by 100.
Sales Conversion Rate = (Conversions / Total Leads or Prospects) x 100
Close 30 deals from 200 qualified leads last quarter and your lead-to-close rate is 15%. That’s the math. The decision that actually matters is what goes in the denominator, because that single choice changes both the number and what it means.
Count every raw inbound inquiry and your rate looks low, but now you’re measuring marketing volume as much as selling. Count only qualified leads, the ones with real need, budget, and authority, and the rate reflects how well your team closes deals worth closing. Neither is wrong. What kills the metric is inconsistency. A conversion rate only tells you something when the definition holds steady, so if you change what you count every quarter, your trend line is fiction.
Since every stage has its own rate, most teams watch several at once:
Ranges compiled from B2B funnel research and full-funnel conversion data. Reading the rates stage by stage is how you find where deals actually die. A single blended number hides it every time.
What counts as a good sales conversion rate?
The honest answer: it depends on what you sell and who you sell it to. A good sales conversion rate swings wildly by industry, deal size, cycle length, and lead source, so any single benchmark is a loose reference, not a target. Long, complex enterprise deals run lower rates than fast transactional ones, and on its own neither number tells you much.
A couple of reference points help you calibrate. Most B2B SaaS opportunity-to-close rates land between 15% and 30%, with the top teams pushing past that. And the biggest leak in most B2B funnels is the MQL-to-SQL handoff, where marketing’s leads either turn into real pipeline or quietly disappear.
But the comparison that actually moves people is against themselves. Tell a rep they’re below some industry average and you’ll get a shrug. Show them their discovery-to-proposal rate sits well under your own top performer’s, and now they’ve got a target that’s real. Harvard research found people who actively tracked their progress toward a goal performed 30% better than those who didn’t. Internal benchmarks are what make that tracking concrete. Your own trend line beats any number you’ll find online.
For a financial services team running a mix of advisors across branches, this internal-benchmark habit matters even more, since a “good” conversion rate for a seasoned advisor with a warm book looks nothing like a good rate for someone six months into a new territory. Comparing both against a single external number flattens a distinction that actually drives coaching decisions.
Why the conversion rate matters more as a diagnostic than a scoreboard
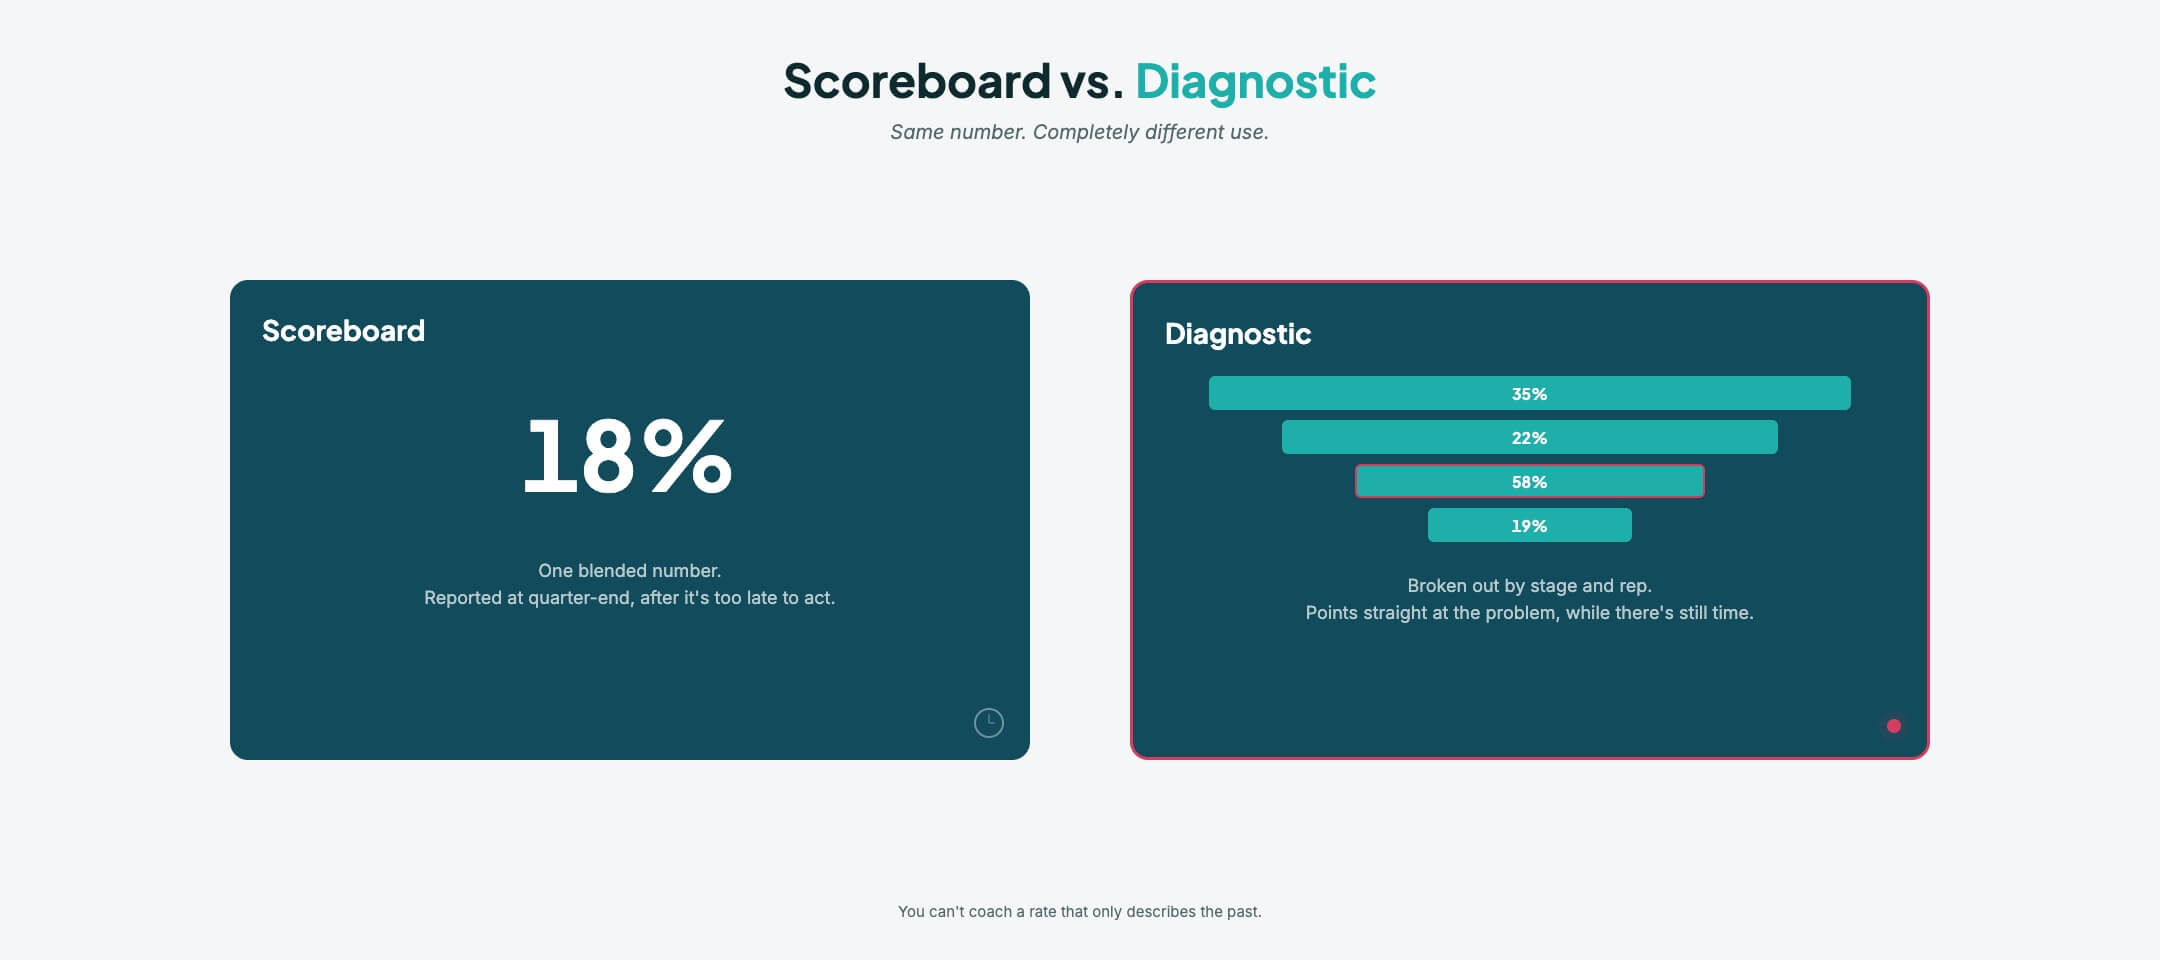
Here’s where most teams leave value on the table. They treat the conversion rate as a scoreboard, a number you report at quarter-end to show how it went. Used that way, it’s a lagging indicator, and by the time it moves, the quarter’s already gone. You can’t coach a rate that only describes the past.
Read it as a diagnostic instead and everything changes. A blended lead-to-customer number tells you almost nothing about what to do next. Break it down by stage and it points straight at the problem. Strong discovery-to-qualified rate but a sinking proposal-to-close rate? That’s not a top-of-funnel issue, so pumping in more leads won’t fix it. It’s an evaluation problem, and it gets solved somewhere else entirely.
Read at the stage and rep level, the rate becomes an early warning. A rep whose meeting-to-opportunity rate has quietly slipped over three weeks is showing you a problem taking shape, well before it hits the revenue line. That’s a coaching moment with time still on the clock, not a post-mortem. The number stops being a verdict on last quarter and starts being a heads-up about the next one.
How to improve your sales conversion rate
Improving a conversion rate doesn’t start with staring at the rate. It starts with finding the exact stage where deals leak, then fixing the behavior behind the leak. A few levers do most of the work.
Tighten qualification first. A lot of low conversion is just bad deals sneaking into the funnel early, padding the denominator and dragging the rate down. Reps burning hours on deals that were never real is a qualification problem wearing a conversion-rate costume. Fix the entry criteria and the rate often climbs more than any clever closing tactic would move it.
Then respond faster. Speed to lead is one of the most underrated levers you’ve got. Reply to an inbound lead within five minutes and you’re 21 times more likely to qualify it than if you wait 30. Teams that follow up within the hour convert at 53%, against 17% for the ones who wait past a day. Most of that gap is process, not talent.
Then coach the leaking stage. Once the data shows you where deals die, the fix is a behavior change right there: sharper discovery questions, cleaner next-step discipline, better multi-threading so one quiet champion can’t sink the deal. The conversion rate tells you where to look. The coaching conversation is what moves it. For the stage definitions that make this diagnosis possible, see our breakdown of sales pipeline stages, and for how this fits the wider metric set, why your sales KPIs should focus on conversion rates.
For a multi-location insurance agency, the leaking stage often isn’t the same across offices. One branch might be losing deals at proposal, another at negotiation, and averaging the two into a single company-wide rate hides both problems from the people who could actually fix them.
The SalesScreen approach: turning the rate into behavior
A conversion rate only improves when someone changes what they do. That’s the part most measurement setups quietly skip. The number gets tracked, the dashboard gets built, the report lands on Friday, and rep behavior on Tuesday afternoon looks exactly like it did the Tuesday before. Measuring the rate beautifully does nothing on its own. The gap between having the number and improving it isn’t a data gap. It’s a behavior gap.
That’s the gap SalesScreen is built to close. One idea runs through all of it: measurement only changes results when it’s tied to visibility, coaching, and recognition that reach your reps every day. A stage-level conversion rate only a manager sees once a month can’t change anyone’s behavior. That same rate, live in front of the rep next to where they rank against their peers, gives them a reason to move before the period’s over.
The loop is the whole point. An early signal flags a stage where conversion’s slipping. Visibility puts it in front of the rep and manager while there’s still time to act. Coaching turns it into a specific behavior change. Recognition makes the fix stick so it happens again. That’s how a conversion rate stops being a number you report and becomes a behavior you build. The metric spots the problem. The visibility and recognition around it are what actually solve it. See how it works.
Frequently asked questions
What is a good sales conversion rate?
It depends on your industry, deal size, and which stage you’re measuring. Most B2B SaaS opportunity-to-close rates sit between 15% and 30%, with top performers above that. Don’t chase an industry average, though. Compare your rate to your own history and to your best reps, because those benchmarks are both more credible and more useful for actually improving.
How do you calculate sales conversion rate?
Divide your conversions by the total leads or prospects who entered the stage, then multiply by 100. So 30 closed deals from 200 qualified leads is a 15% rate. The decision that matters is the denominator: counting raw inquiries versus qualified leads gives you very different numbers, so pick one definition and stick with it over time.
What is the difference between conversion rate and win rate?
Win rate is one specific type of conversion rate. It measures opportunities won out of the opportunities that reached the closing stage. A general sales conversion rate can measure any transition in the funnel, like lead to opportunity or MQL to SQL. Win rate is always about the final close. Conversion rate is the broader term that applies at every stage.
Why is my sales conversion rate low?
Usually it’s weak qualification letting bad deals into the funnel early, which pads the denominator. The next most common cause is slow lead response, since teams that follow up within an hour convert far better than those who wait a day. Break your rate down by stage to see exactly where deals are leaking, instead of treating one low blended number as a single problem.
Should each sales rep track their own conversion rate?
Yes. When reps can see their own rate by stage, in real time, they self-correct faster and more often than when the number only reaches them through a manager weeks later. Individual, stage-level visibility turns the metric into a daily coaching tool instead of a scoreboard nobody looks at until it’s too late.